Urban EcoMap, San Francisco & Amsterdam, 2008


Urban Ecomap enables Citizens to view their GHG neighborhood and track changes over time.
Urban EcoMap provides visibility of Green House Gas Emissions (GHG) by city neighborhood and enables individuals to explore, learn, and plan how to reduce their personal footprint. It’s an interactive space that empowers citizens to make informed decisions and take action on changes they can make in their daily lives that will reduce CO2 Emissions.
In a collaborative effort between our Cisco team and San Francisco’s Department of the Environment, Urban EcoMap was developed to help the city to reduce its output of GHG. Our Cisco team led the website design and supporting analytics. New processes were established with the city to enable the collection and aggregation of data by zip code from power, waste and transport departments. The Cisco team developed the analytics to calculate the resulting volume of CO2 by zip code that populates the map view.
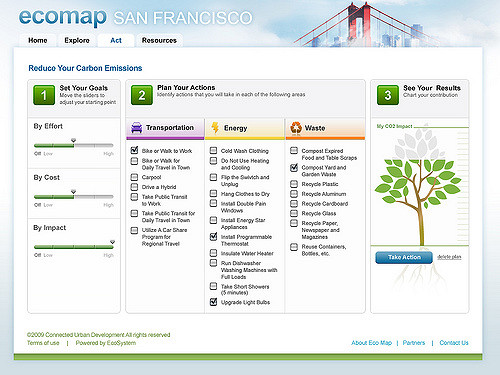
Citizens can select an aggregate view of their neighborhood’s GHG output, or segment by transport, energy or waste. A planning tool enables them to quickly and easily develop their own personal GHG reduction plan. Links to resources are provided such as bike path routes, lightbulb advice and lessons on composting. Citizens can also upload videos of their activities to the site and plans can be shared on Facebook.
Urban EcoMap Visual Preview from Connected Urban Development on Vimeo.
Related Information
UrbanEco Map Fact Sheet